At Twin Flame Group, we turn data into direction. Whether you're scaling a startup or sharpening strategy, our fast-track business consulting services help you act on what matters—fast.
Accelerate results with proven frameworks, real-time analytics, and expert guidance tailored to your growth stage. From leadership strategy to operational clarity, we help you make confident decisions that drive measurable impact.
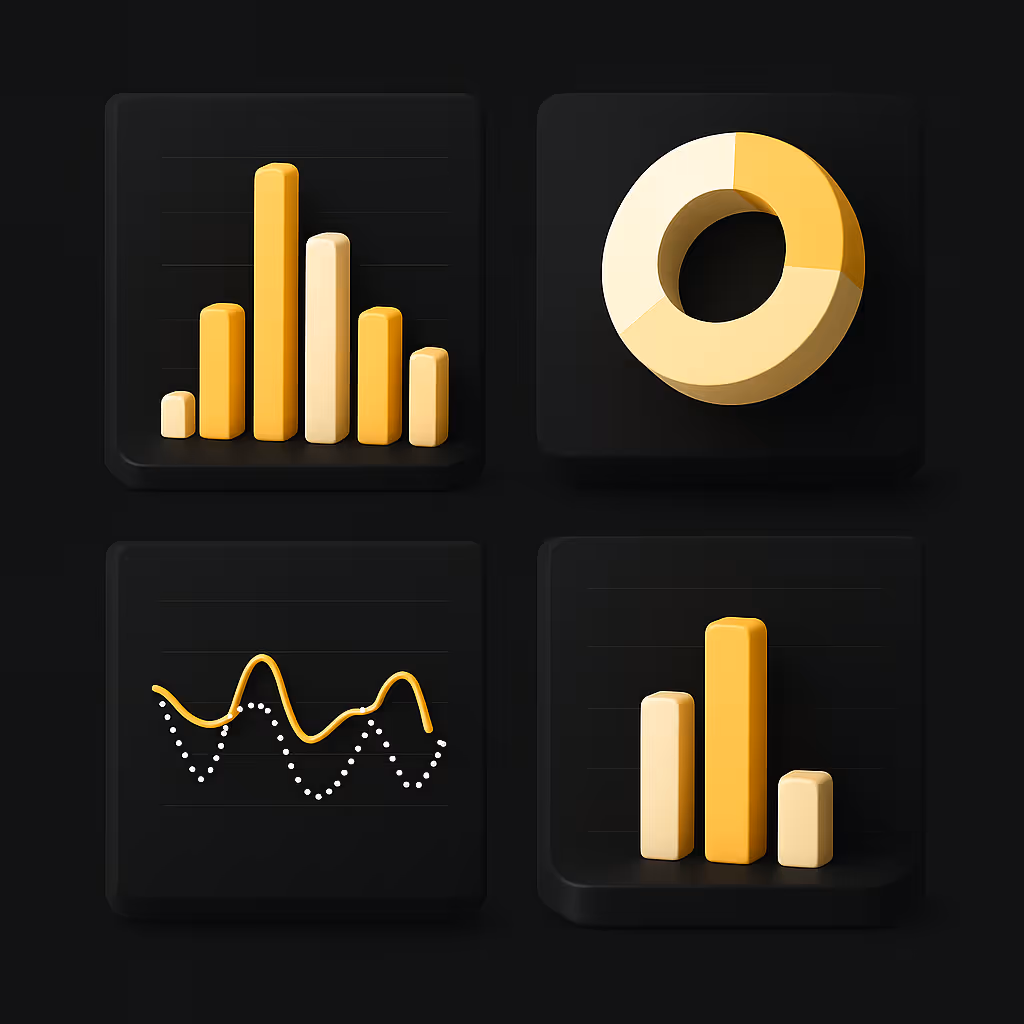

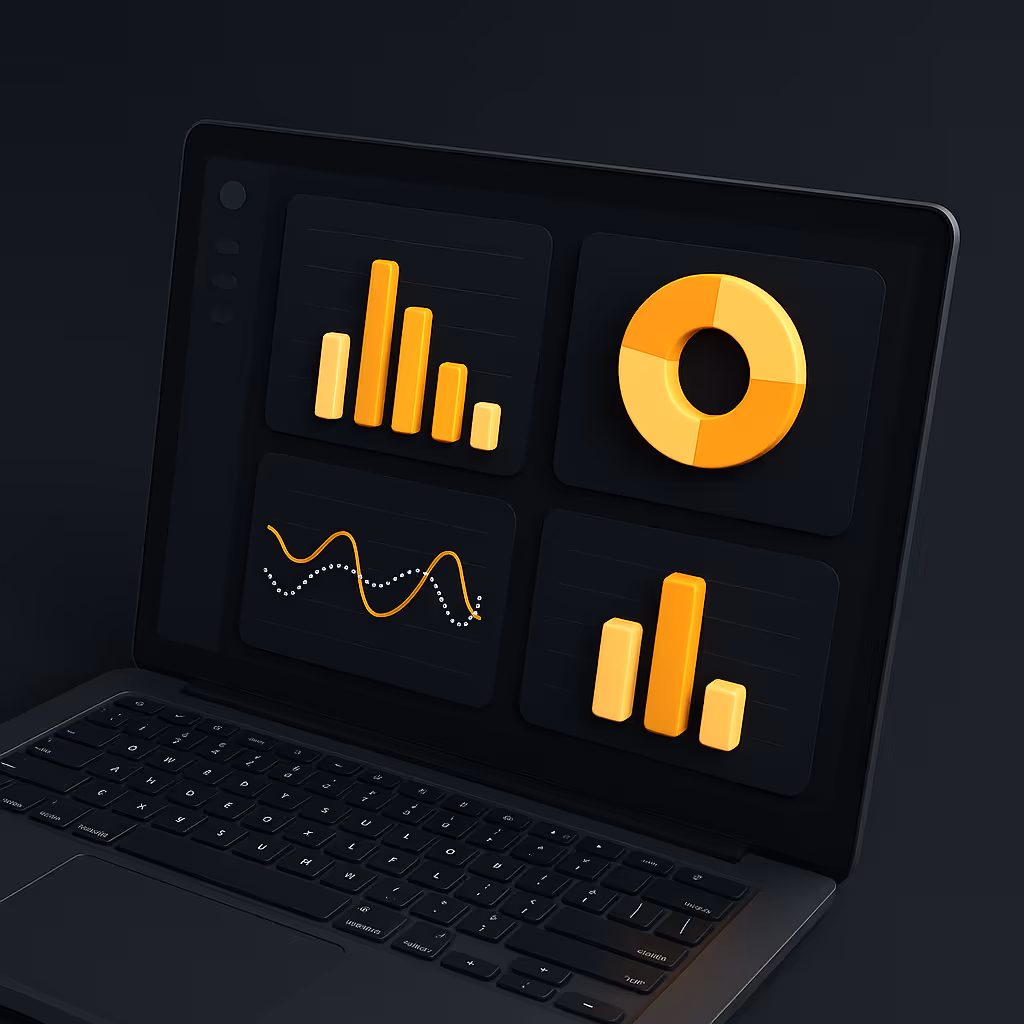
Build custom dashboards to track KPIs that matter most. No coding needed—just clarity, instantly.
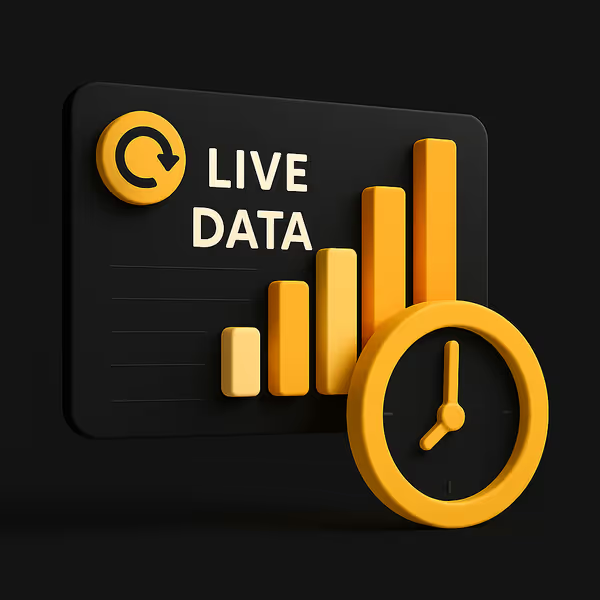
Stay current with live data feeds that keep your team aligned and informed as trends shift.
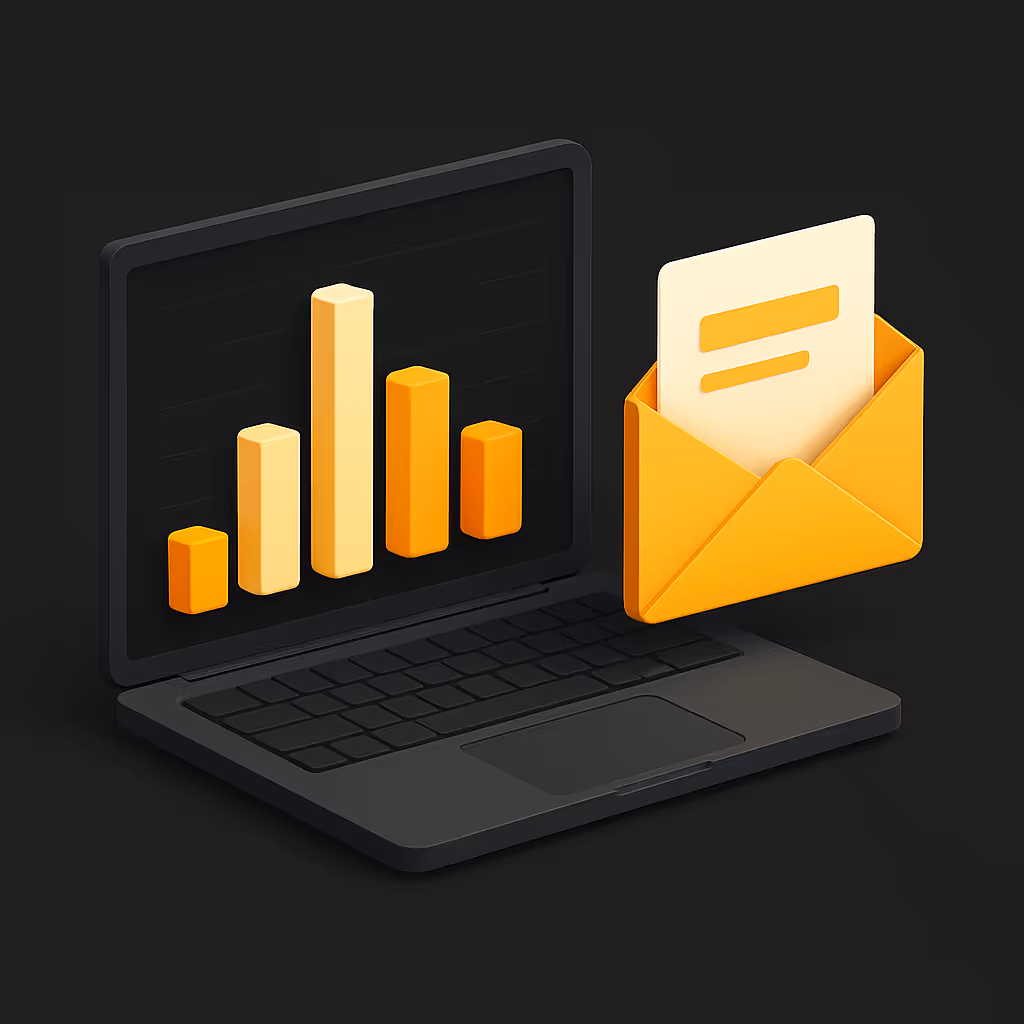
Stop spending hours on reports. Set up automated email updates so you can focus on strategic decision-making.

Share insights with your team in real-time. Edit, comment, and analyze together for better alignment and faster execution.

Always stay up-to-date with live data flowing directly into your dashboard. Track changes as they happen.
Tailor your dashboard to show the metrics that matter most. Create multiple views for different team members or purposes.
Easily share your insights with the team. Comment, edit, and collaborate on reports without leaving the platform.
Save time with automated, scheduled reports. Get the insights you need, delivered straight to your inbox.
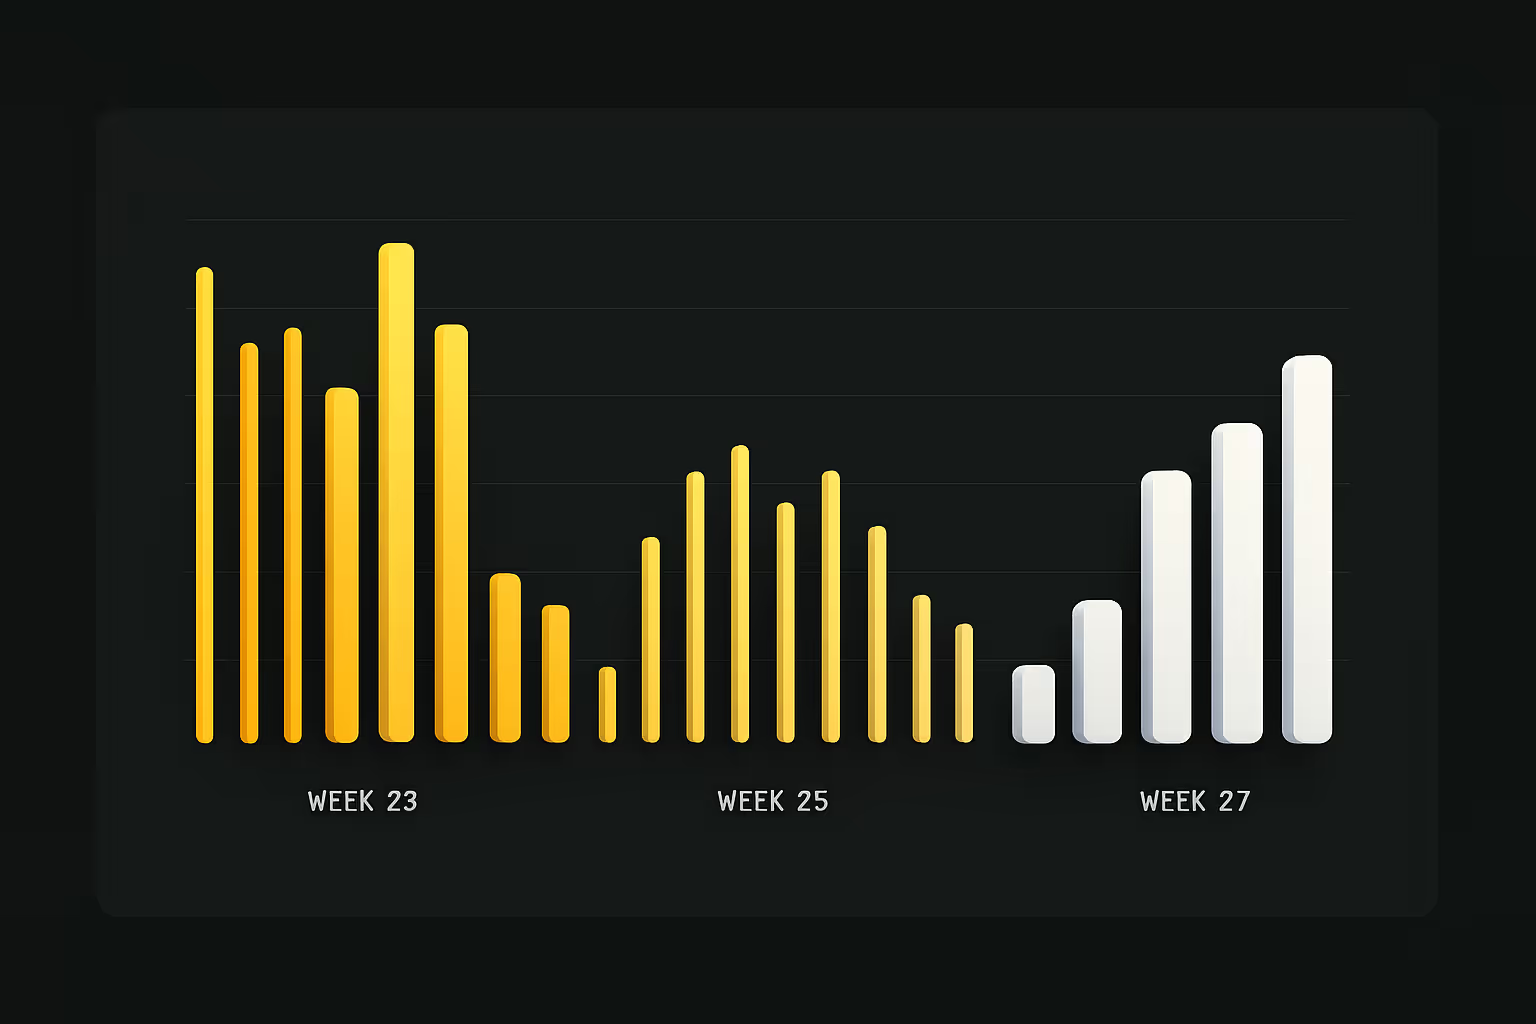
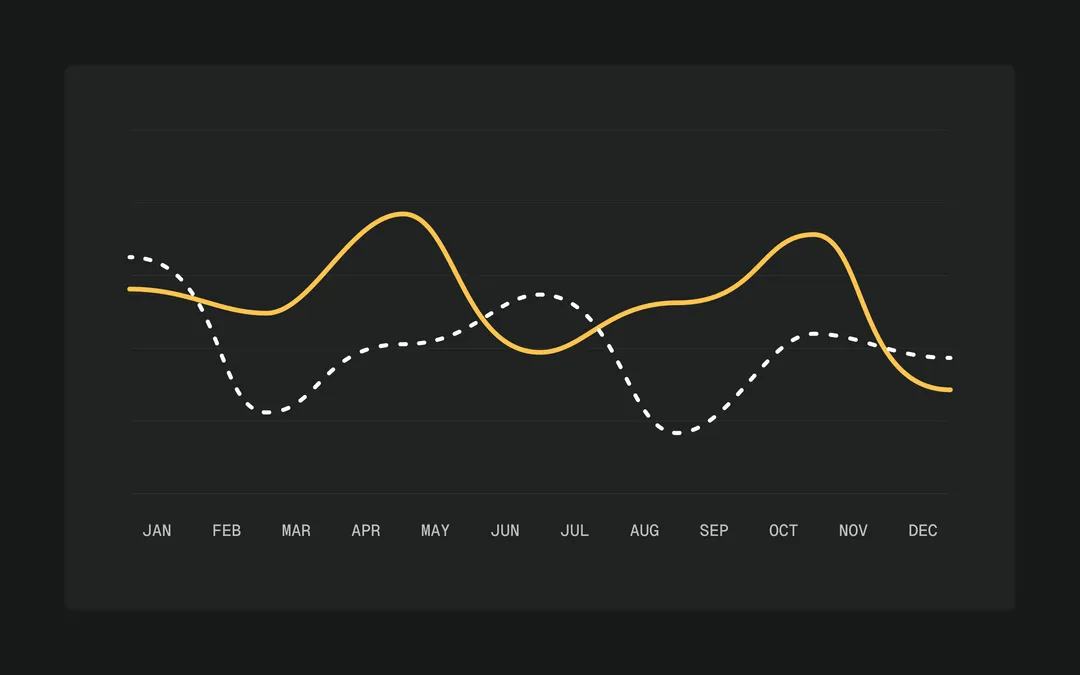
Discover patterns and trends in your data effortlessly. Visualise historical data to forecast future performance.
Dive deeper into your data with interactive charts. Hover and click for more detailed insights and breakdowns.


Answers to questions you might have about Twin Flame Dashboards.

TF Dashboards is a data analytics platform that helps businesses track, visualise, and optimise their performance metrics in real-time. It enables teams to make data-driven decisions through customisable dashboards and powerful insights.
TF Dashboards is ideal for startups, tech companies, and growing businesses that want to harness the power of their data. It’s built for teams looking to improve their decision-making by tracking key performance indicators (KPIs) across all departments.
Security is our top priority. TF Dashboards uses end-to-end encryption, secure data centres, and regular security audits to ensure your data is protected at all times. We also offer role-based access control to manage permissions within your team.
Yes, TF Dashboards integrates with a wide range of tools, including CRM systems, marketing platforms, and cloud storage services. Our API allows for seamless integration, helping you connect TF Dashboards to the software you already use.
Absolutely! TF Dashboard's interface is user-friendly and intuitive, designed for both technical and non-technical users. You can create custom reports, dashboards, and visualisations without any coding knowledge.
Don’t miss a beat — Subscribe to our podcast on Apple & Spotify!


We help founders build strategic, sellable businesses with systems, not hustle.
Proud Member / Partner of:

Developed by Twin Flame Realty Investments dba Twin Flame Group
Terms | Privacy Policy